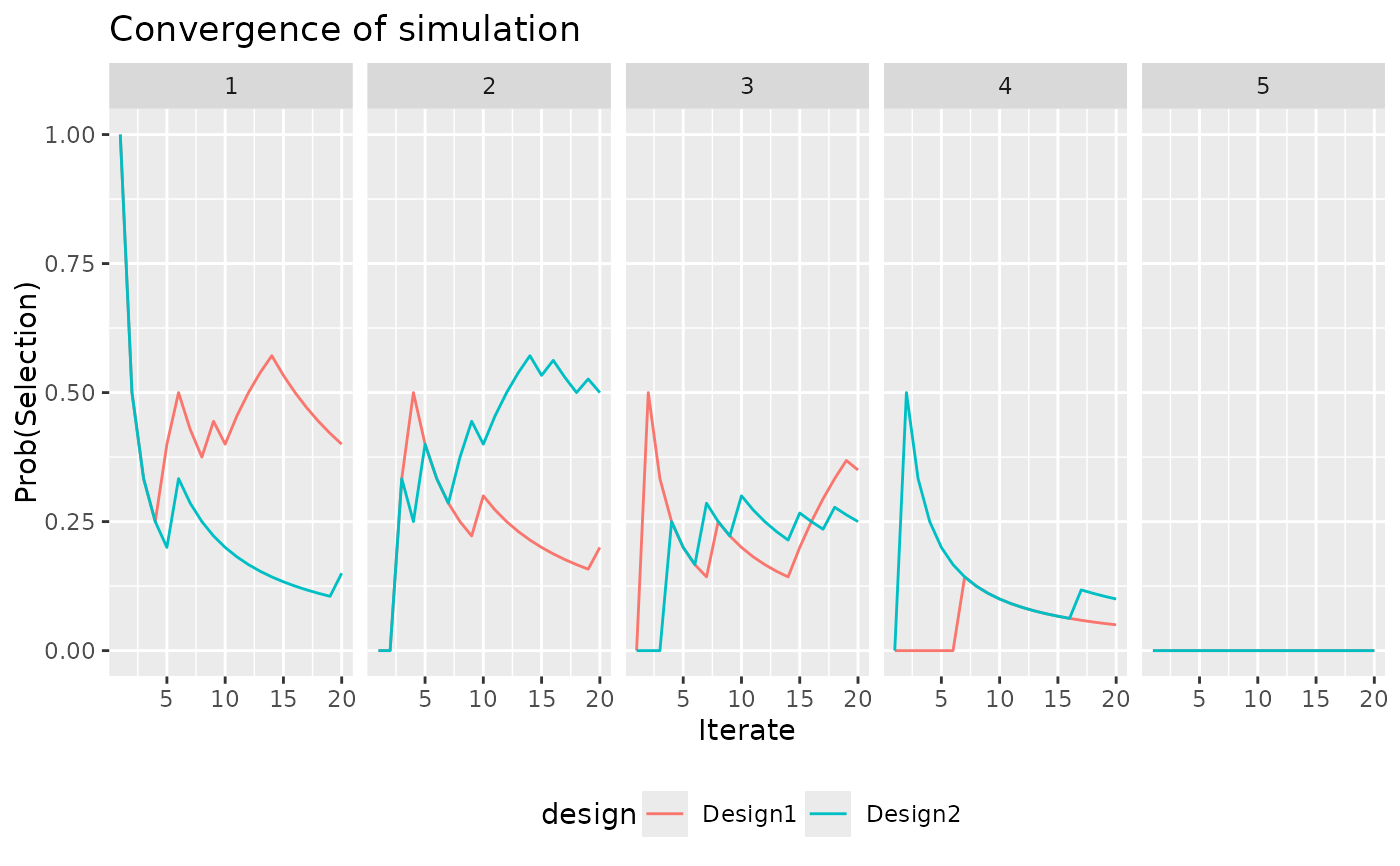
Plot the convergence processes from a collection of simulations.
Source:R/convergence_plot.R
convergence_plot.RdPlot the convergence processes from a collection of simulations.
Arguments
- x
object of type
simulations_collection- ...
extra args are passed onwards to stack_sims_vert
Examples
design1 <- get_mtpi2(
  num_doses = 5, target = 0.25,
  epsilon1 = 0.05, epsilon2 = 0.05,
  exclusion_certainty = 0.95
) %>%
  stop_at_n(n = 12)
design2 <- get_mtpi2(
  num_doses = 5, target = 0.25,
  epsilon1 = 0.1, epsilon2 = 0.1,
  exclusion_certainty = 0.95
) %>%
  stop_at_n(n = 12)
designs <- list(
  "Design1" = design1,
  "Design2" = design2
)
sims <- simulate_compare(
  designs = designs,
  num_sims = 20,
  true_prob_tox = c(0.1, 0.2, 0.3, 0.4, 0.5)
)
#> Running Design1
#> Running Design2
convergence_plot(sims)
